
The 5 CRM Reports that tell you instantly if your Solar Company is failing (+ real numbers from our $10m/year company)
Part of what makes a great CRM is having a robust reporting function.
Part of what has made HubSpot so valuable for Ipsun Solar is the ability to create up to 500 custom reports.
But with so much data and so many reports comes some information overload and analysis paralysis. That’s why we focus on our management dashboard on just 5 reports that sum of the health of the company and allow us to target our efforts where we may be falling short in a given area.
1. Monthly and Weekly Residential Sales (Current vs. Last Year)
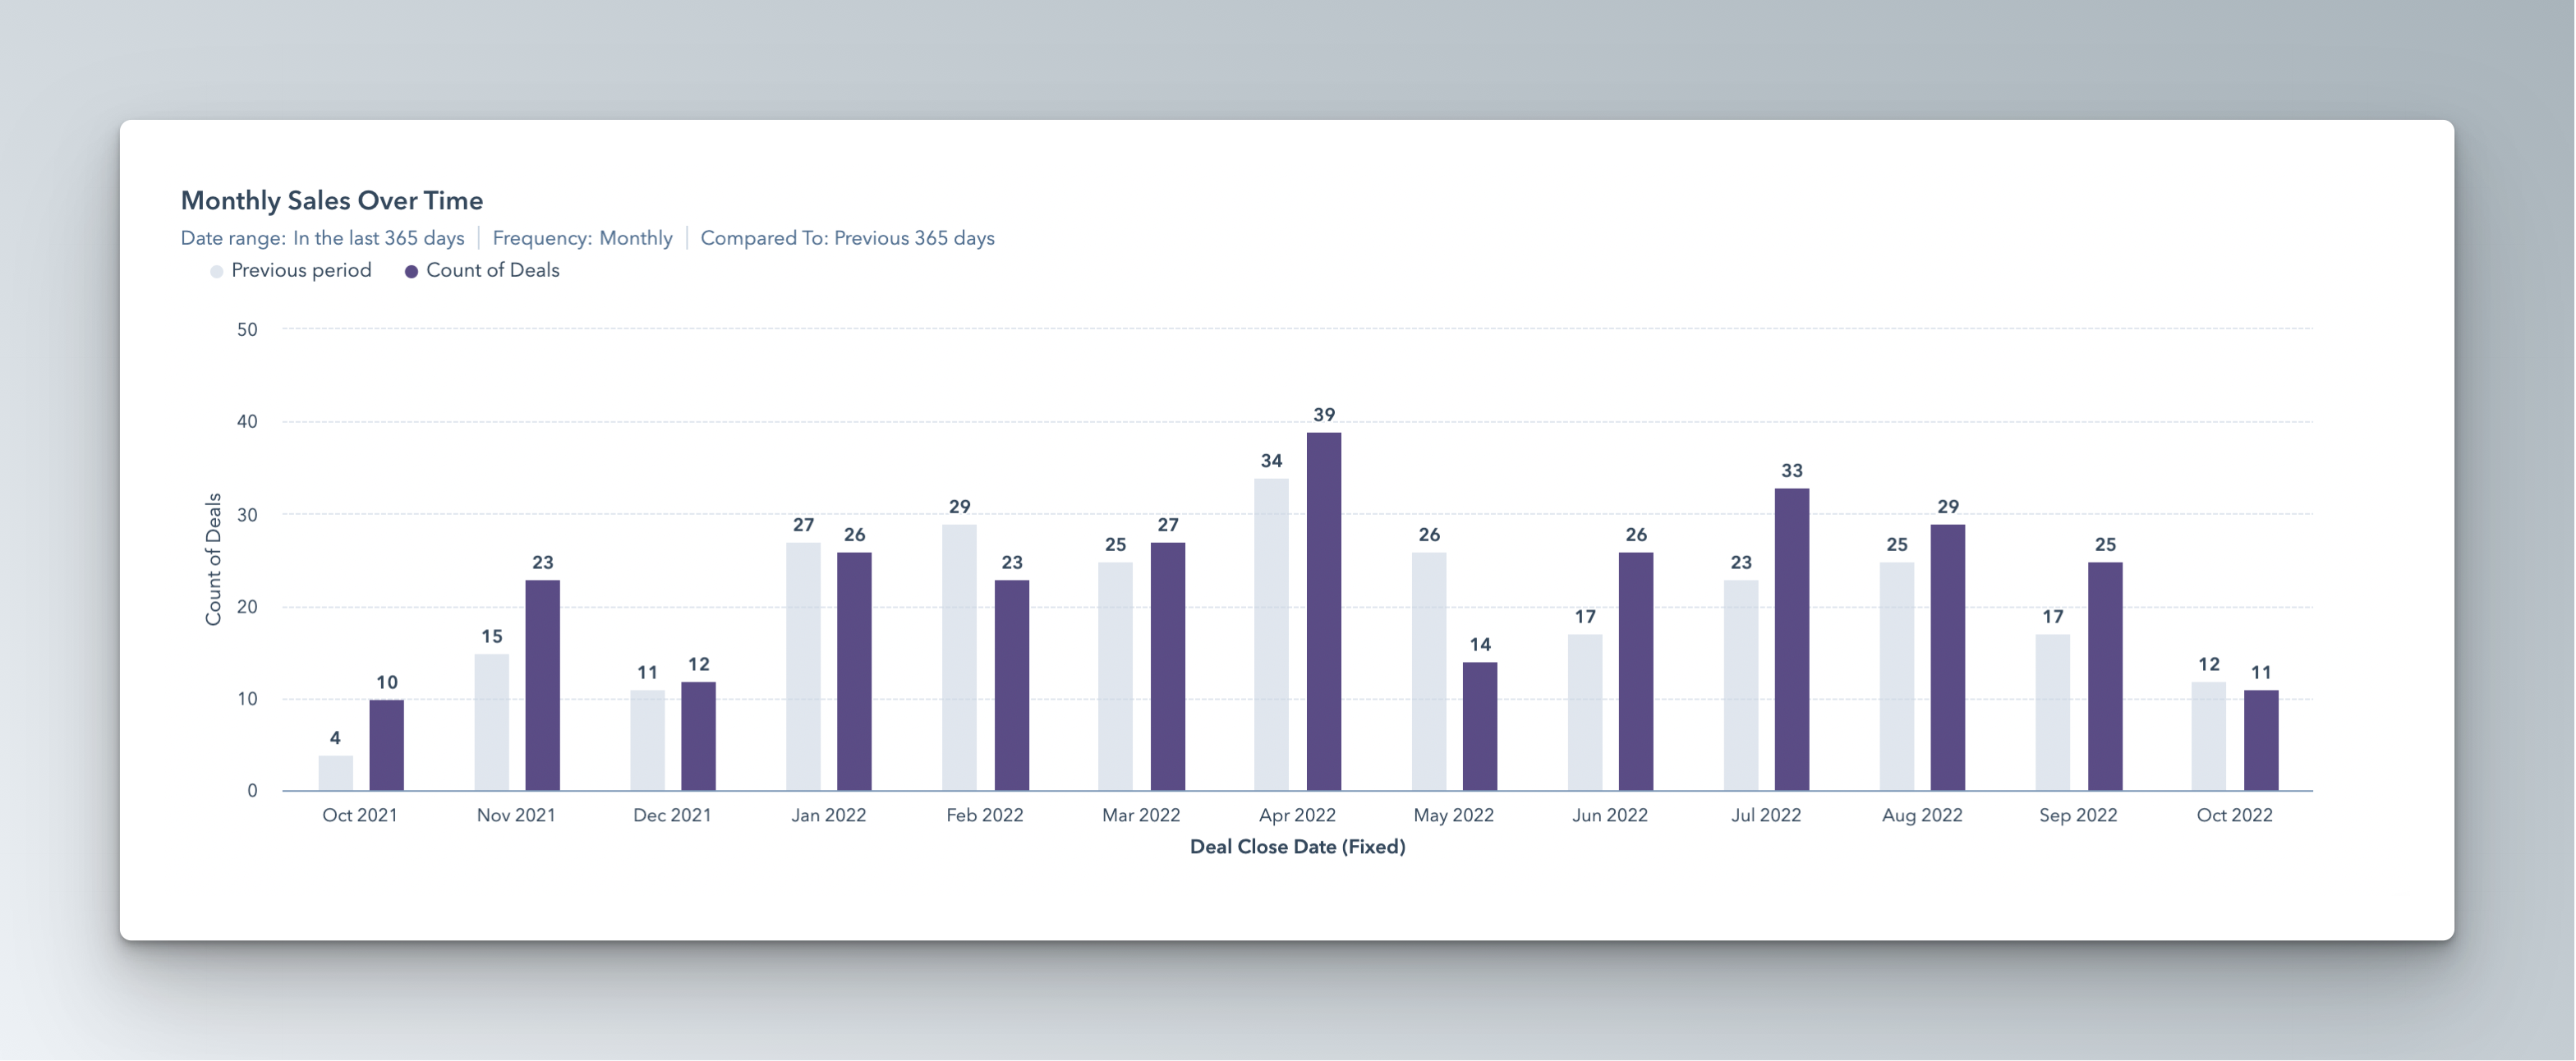
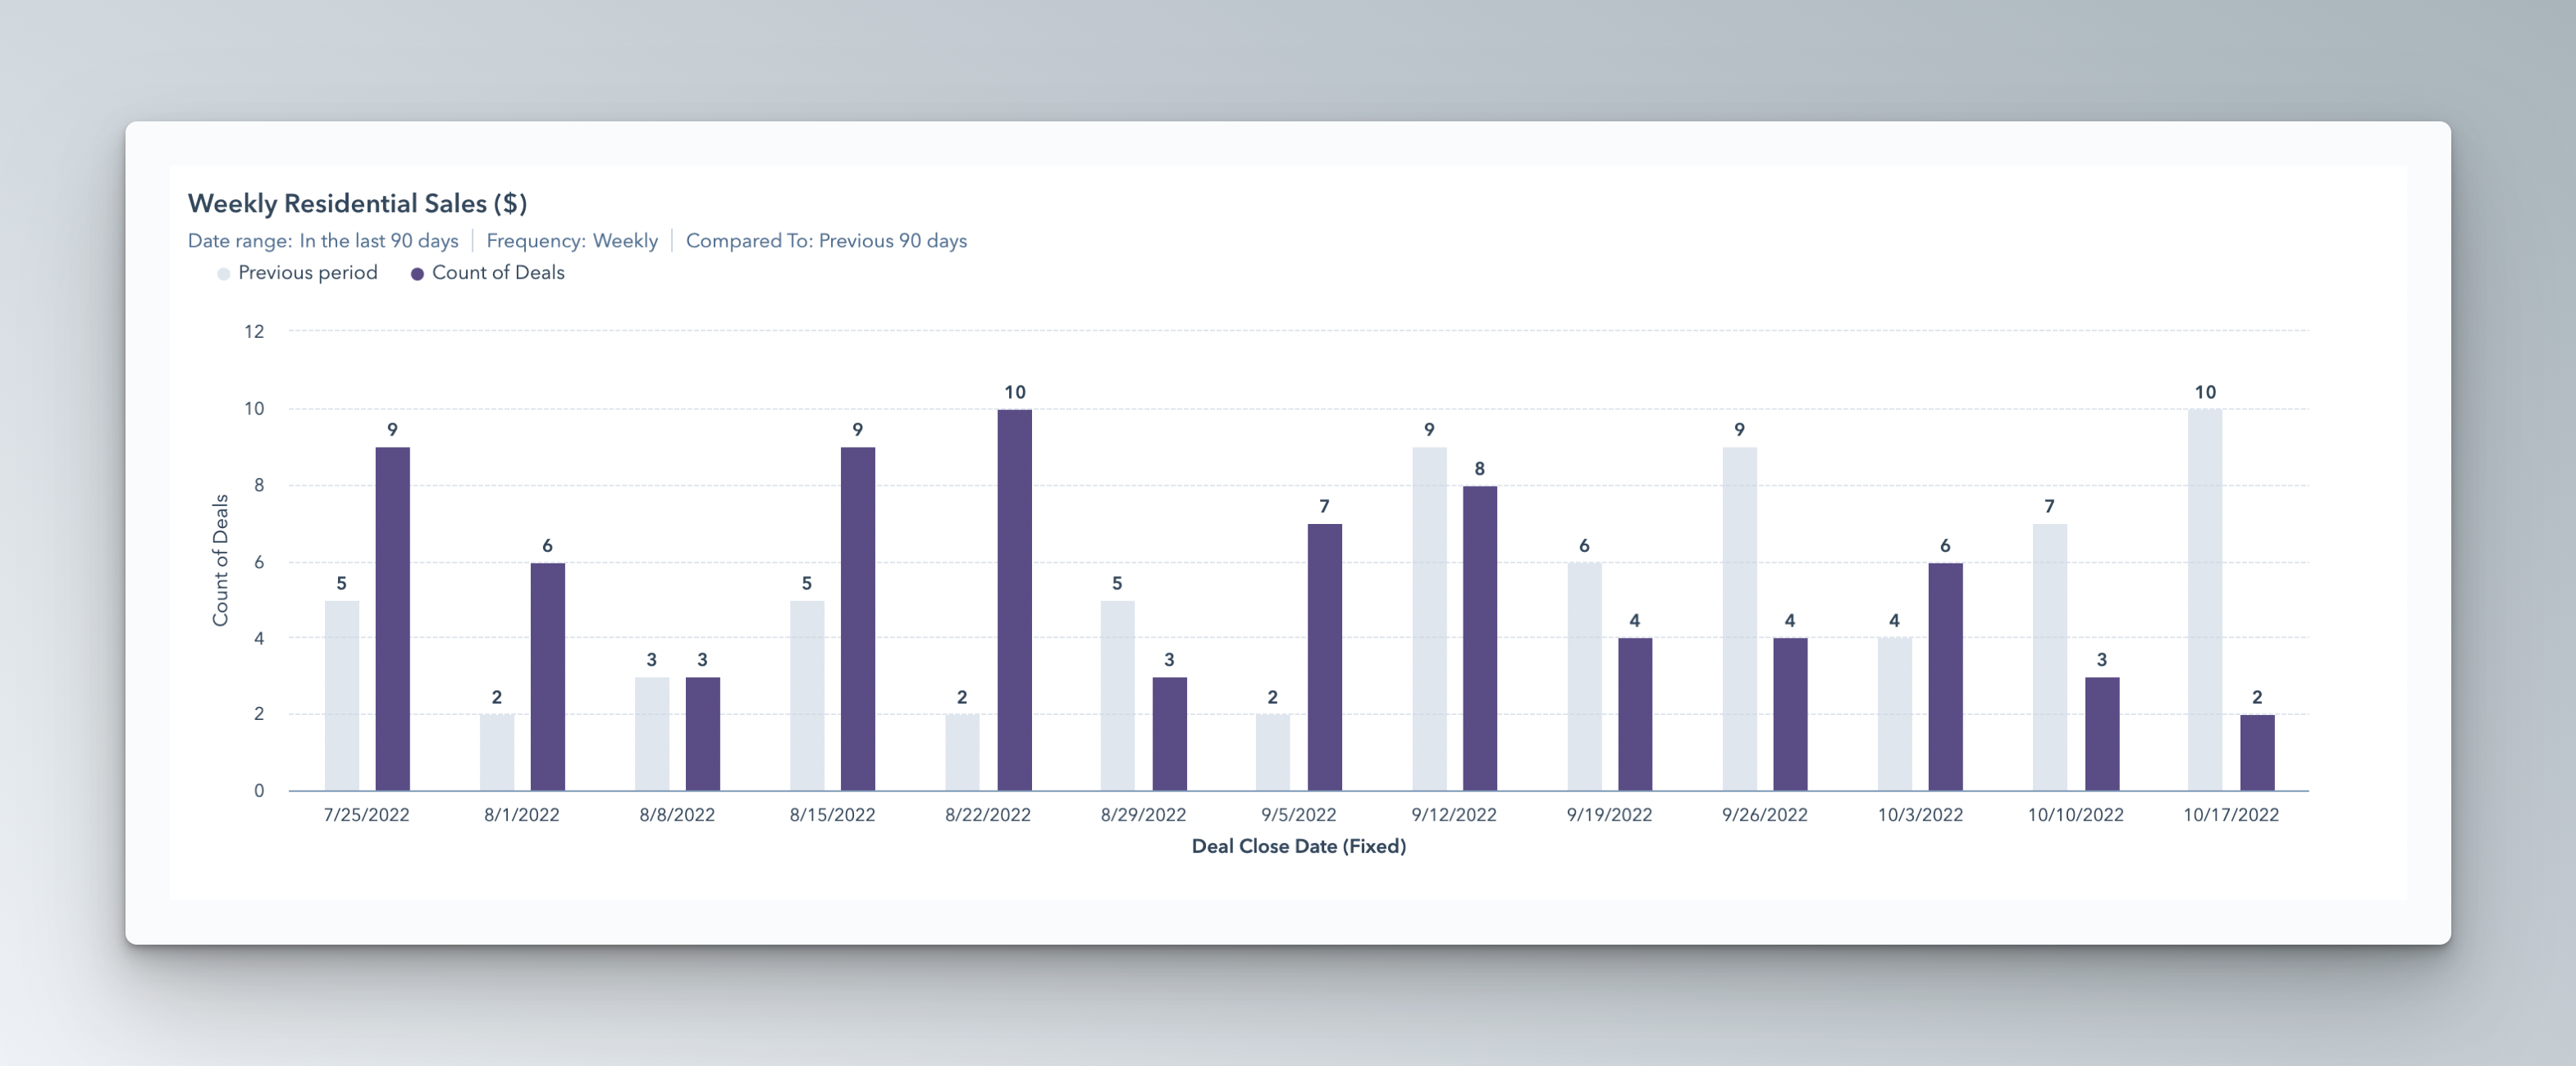
Okay, technically this is two reports, but you get the idea.
Having the ability to see how your sales are doing this month versus the same month last year, and this week versus the same week last year, is really helpful not gauging growth, but also seasonality.
While it may “feel” like a slow January, you can actually see what was happening the same time last year and get a quick snapshot of whether there’s a real concern or trend.
2. Appointments Booked by Month (Current vs. Last Year)
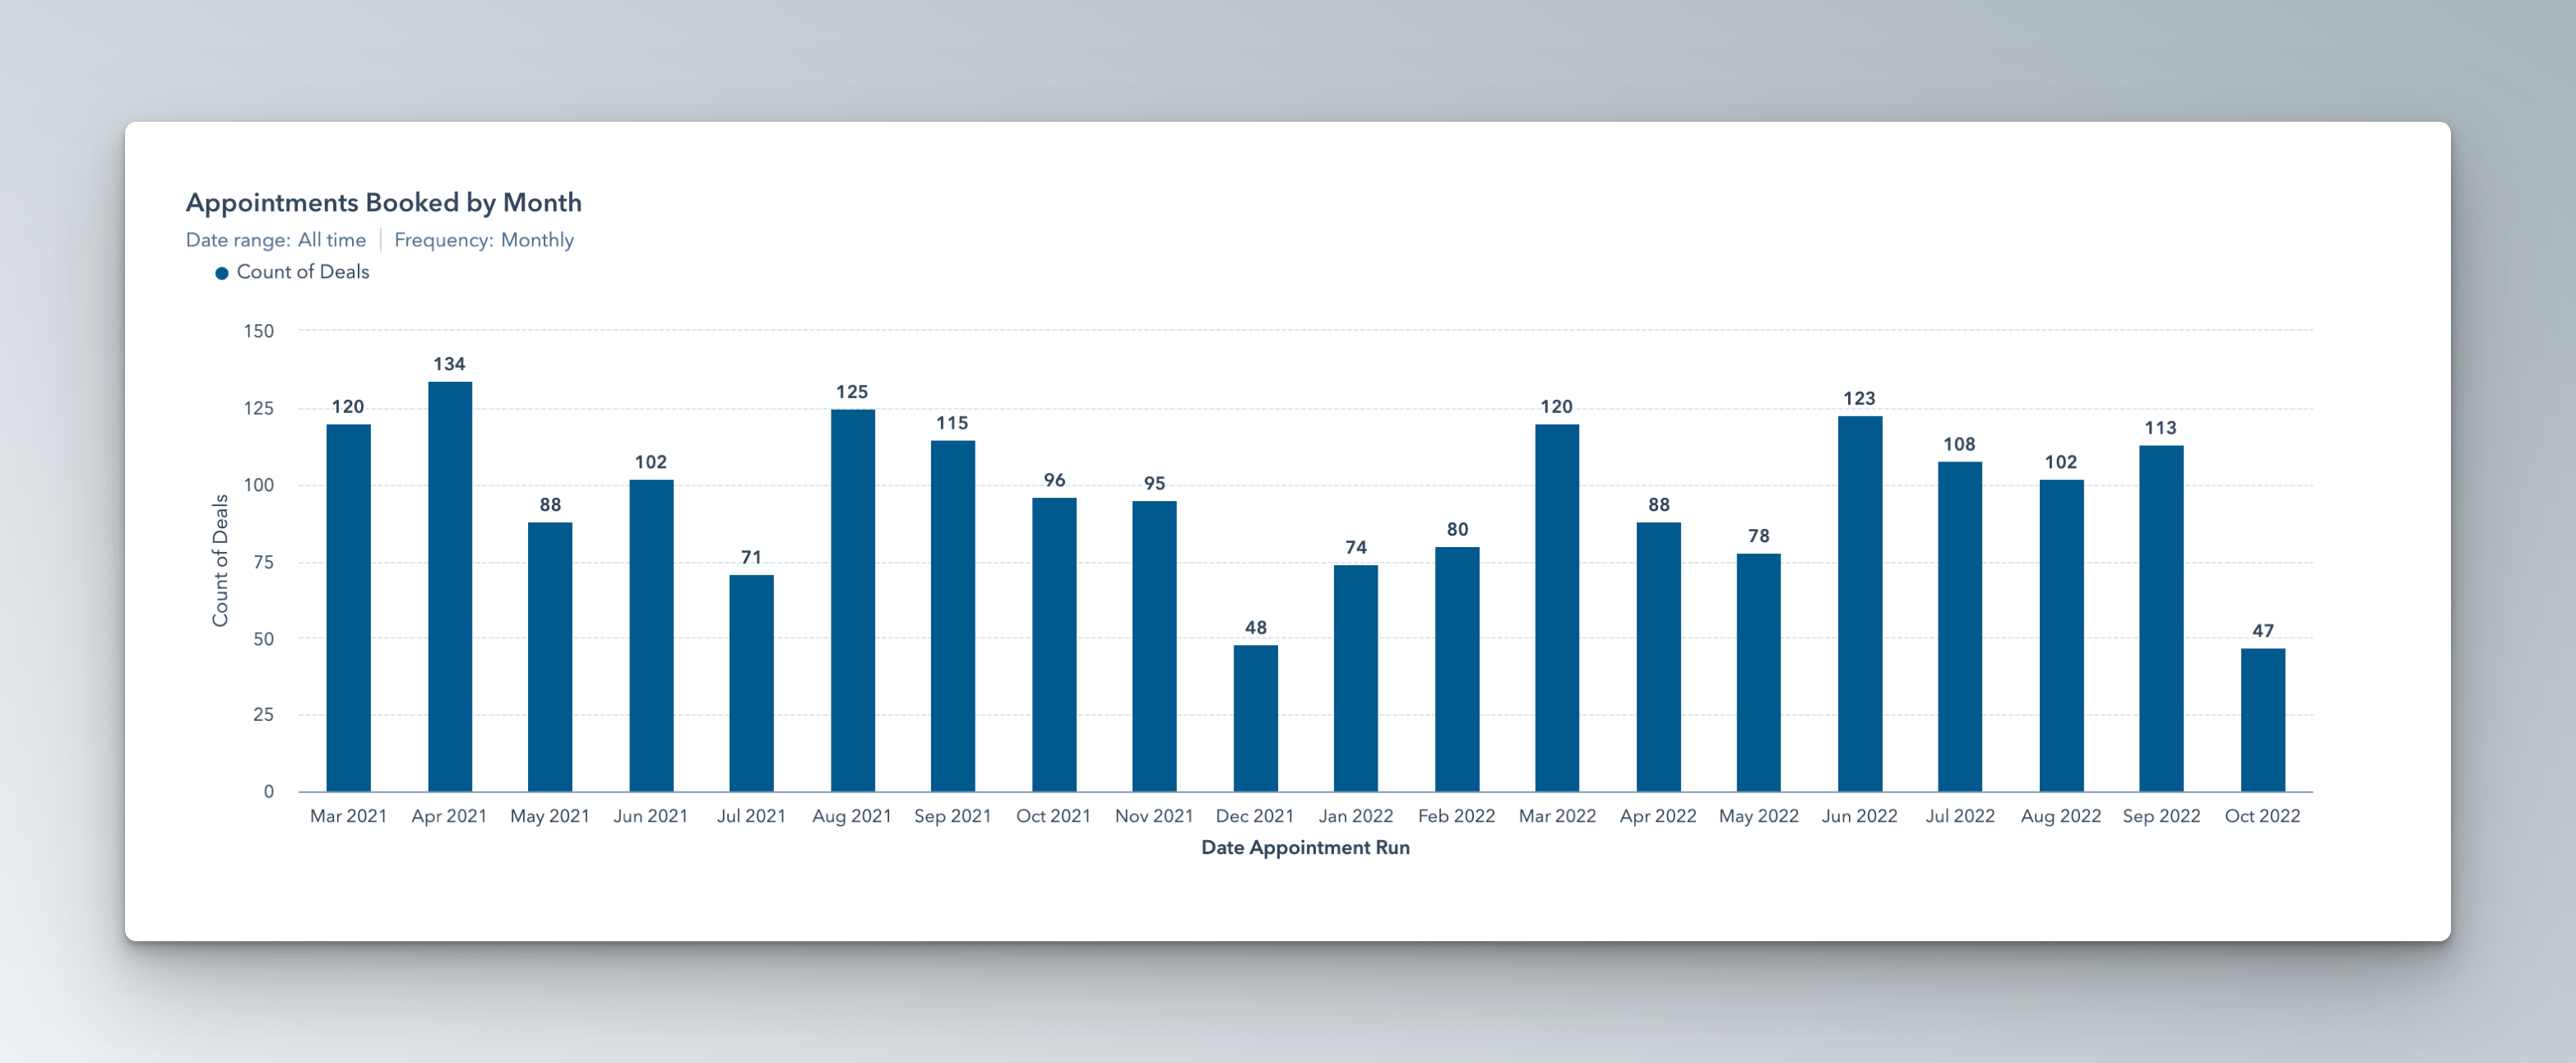
Believe it or not, even though Ipsun Solar has 500 reports in its library, this is the one that we look at the most.
Why?
Because if you have a steady conversion rate on booked appointments, it means that booked appointments are largely going to dictate your monthly sales.
However, lead flow can be “wavy”, depending on the season, vacations, pandemics, etc.
Keeping an eye on this metric can help if there’s a slowdown to add Inside Sales resources, and get creative with your sales team strategy.
This report gives you a sense for how many appointments your outside salespeople are sitting each month, and a comparison to the same time last year.
Once we have year-over-year data, we’ll be able to see if we’re lagging behind on booked appointments and need to increase our marketing spend to catch up.
3. Open Receivables by Deal Stage
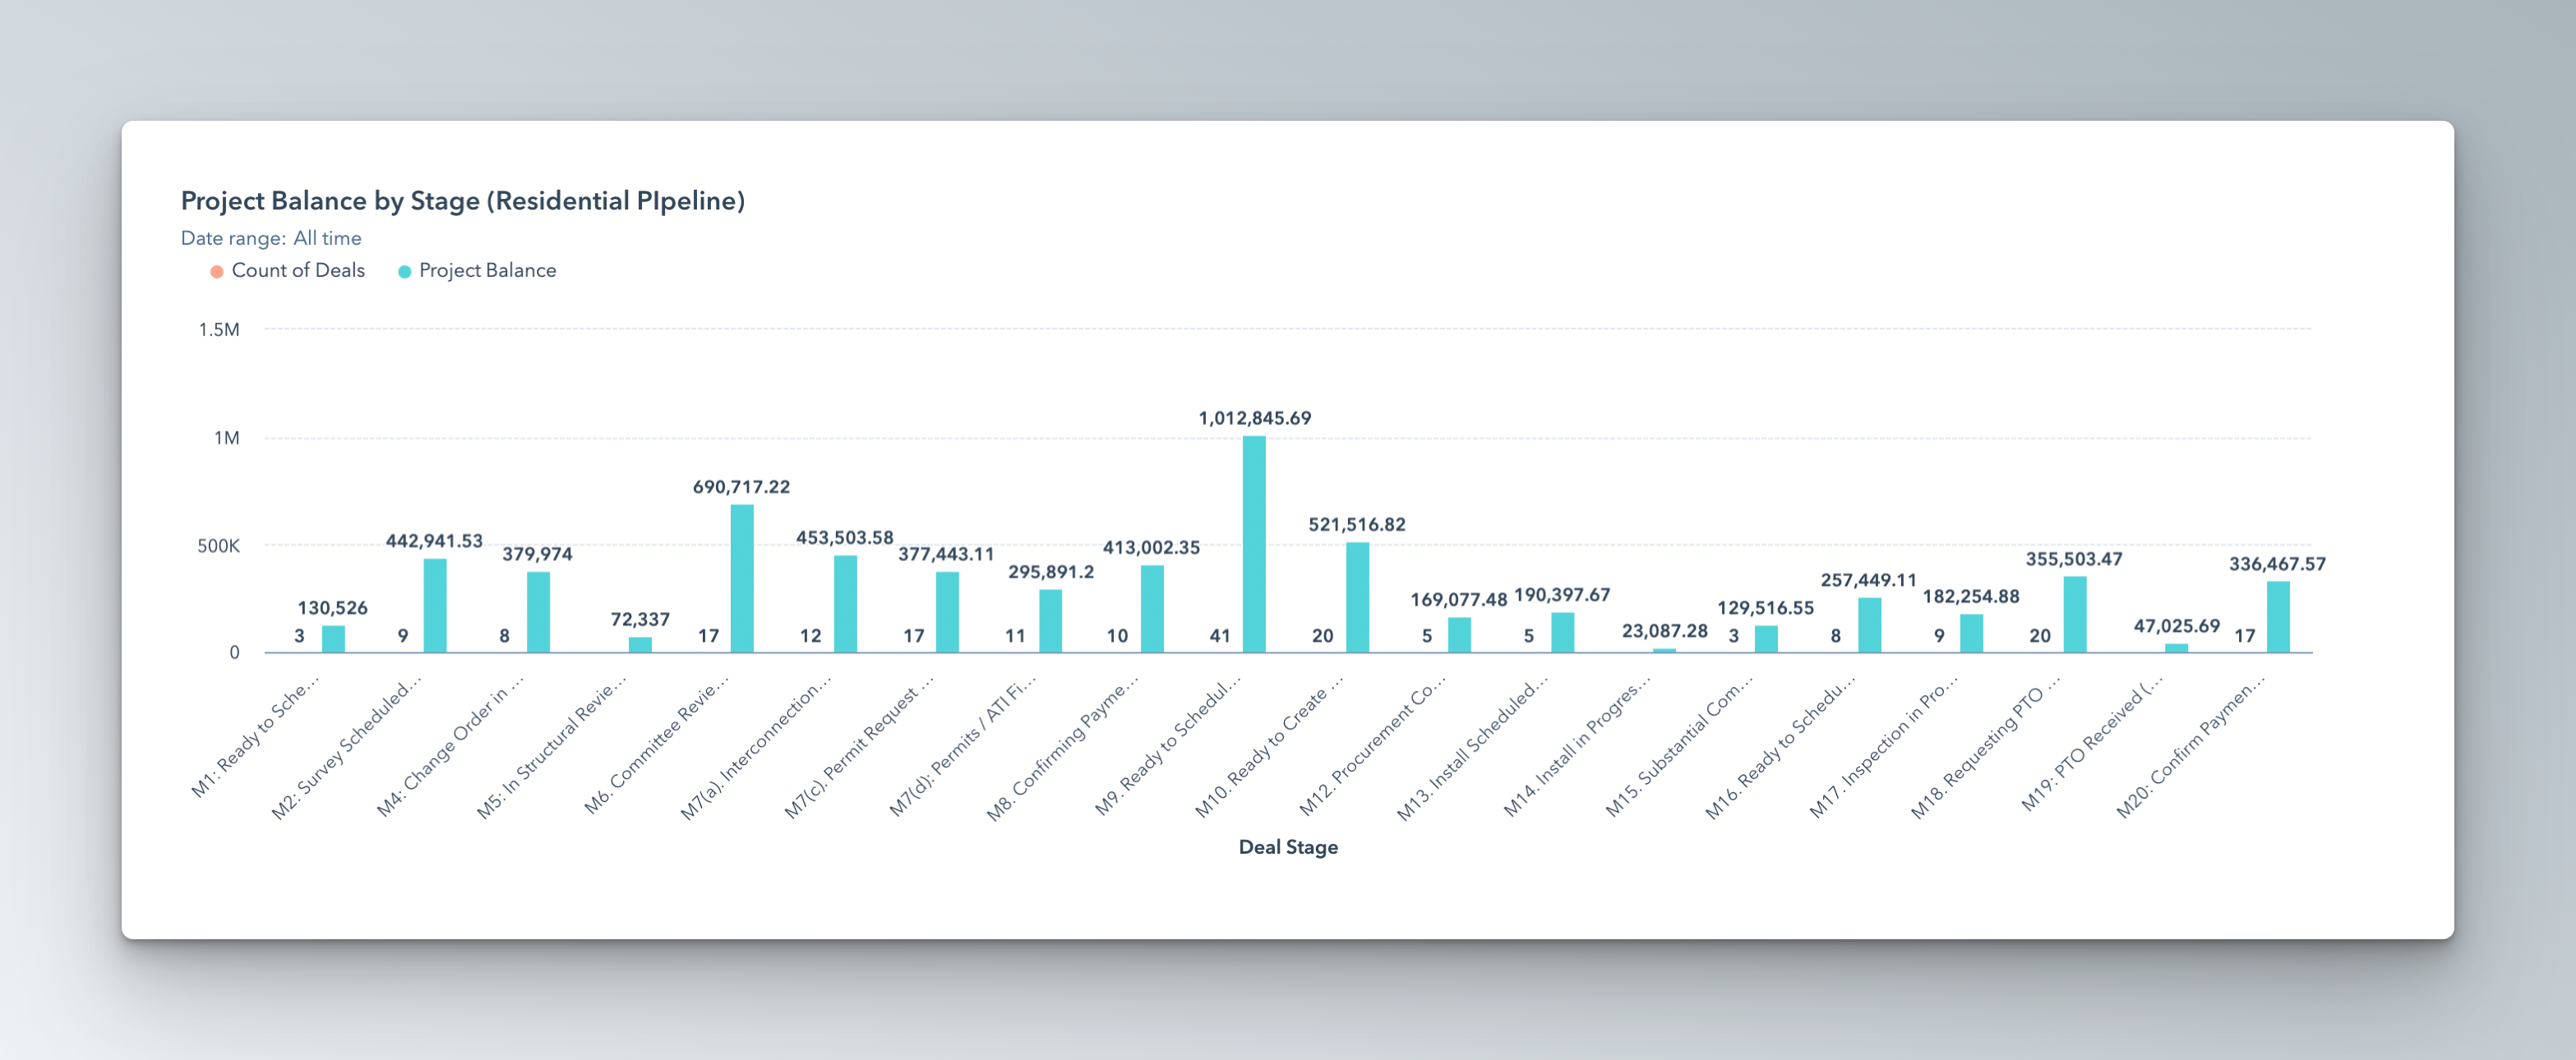
Cash is king in small business, but where’s the outstanding cash sitting?
This report helps show you where your receivables are living in your operations pipeline, and all it requires is your accounting clerk to update residential projects in your CRM as project payments come through.
Then if you have a big slug of cash sitting in a particular part of your pipeline, you can focus the team on that area when needed.
This report has been invaluable for helping us to focus resources over time when there were bottlenecks in our process.
4. Track your installation productivity: Panels Installed by Month
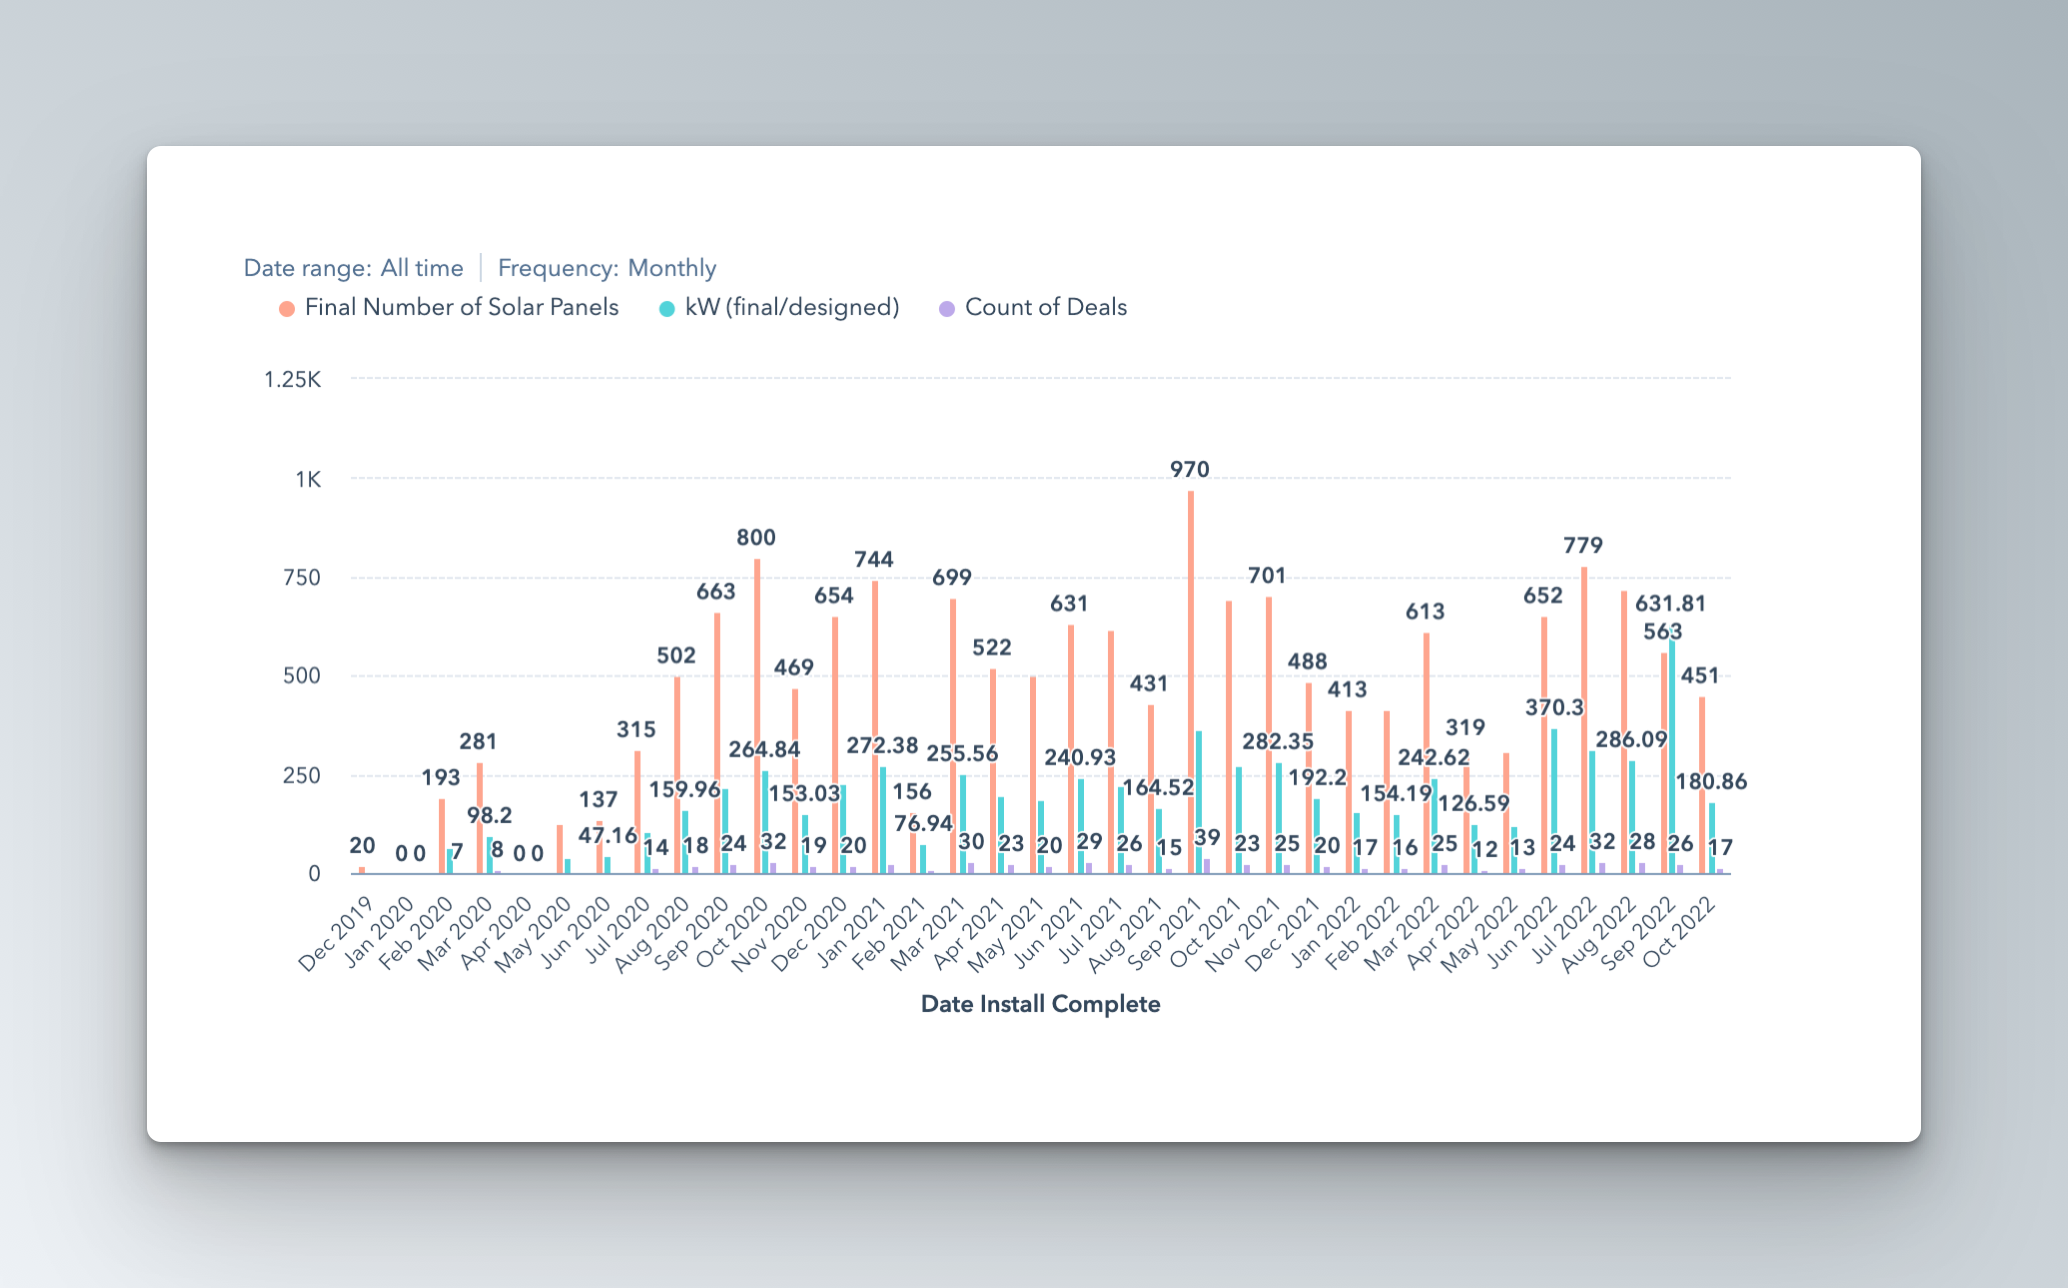
If cash is king, then the queen is panel install productivity.
Almost every solar company’s pricing model must include panels installed per day, and we’re no different.
You may want to track a different metric for your productivity in panels/hr, kW/month but the idea is the same, you need to know your install rate.
By including panels in your reporting, you can see seasonal trends, how training achieves better outcomes, and generally the impact of installation productivity on profitability.
Without this you’re left in the dark.
True story:
last Summer we faced a cash crunch and saw our cash position diminishing.
We thought it was related to our production but we were not sure, as there could be so many variables.
Then I saw a 6kW project being scheduled for a 3 day install.
I looked into it and that 6kW looked like a standard resi install: no steep roofs, no service panel upgrade, no trenching or anything else that usually causes delays.
That’s when I discovered our management thought it was normal, whereas for me, a 6kW is a day, even a half day of work.
As the CEO, I jumped into action and went to install with my crews for weeks and our production tripled overnight.
Our site surveys were good, so our designs were good, so our BOM, procurement and warehousing was good.
So everything was in place, except the drive, urgency or motivation of the team.
Don’t underestimate the encouragement we have by working with our people and along our people.
I am also a Master Electrician and I knew there were endless conversations about how long it took to install batteries.
I said 2 days for a standard install and I knew there were debates about 5 to 6 days.
I then prepared and installed the next battery project.
I did it with my guys in 2 days.
I told them maybe I got lucky and will also do the next one, and again, it got installed in 2 days.
Since then, people know that if the CEO can install it in 2 days, they need to be able to install it in 2 days for a standard install.
CEOs have a large megaphone and leading by example and knowling what we’re talking about is important to lead our team.
5. Backlog Report
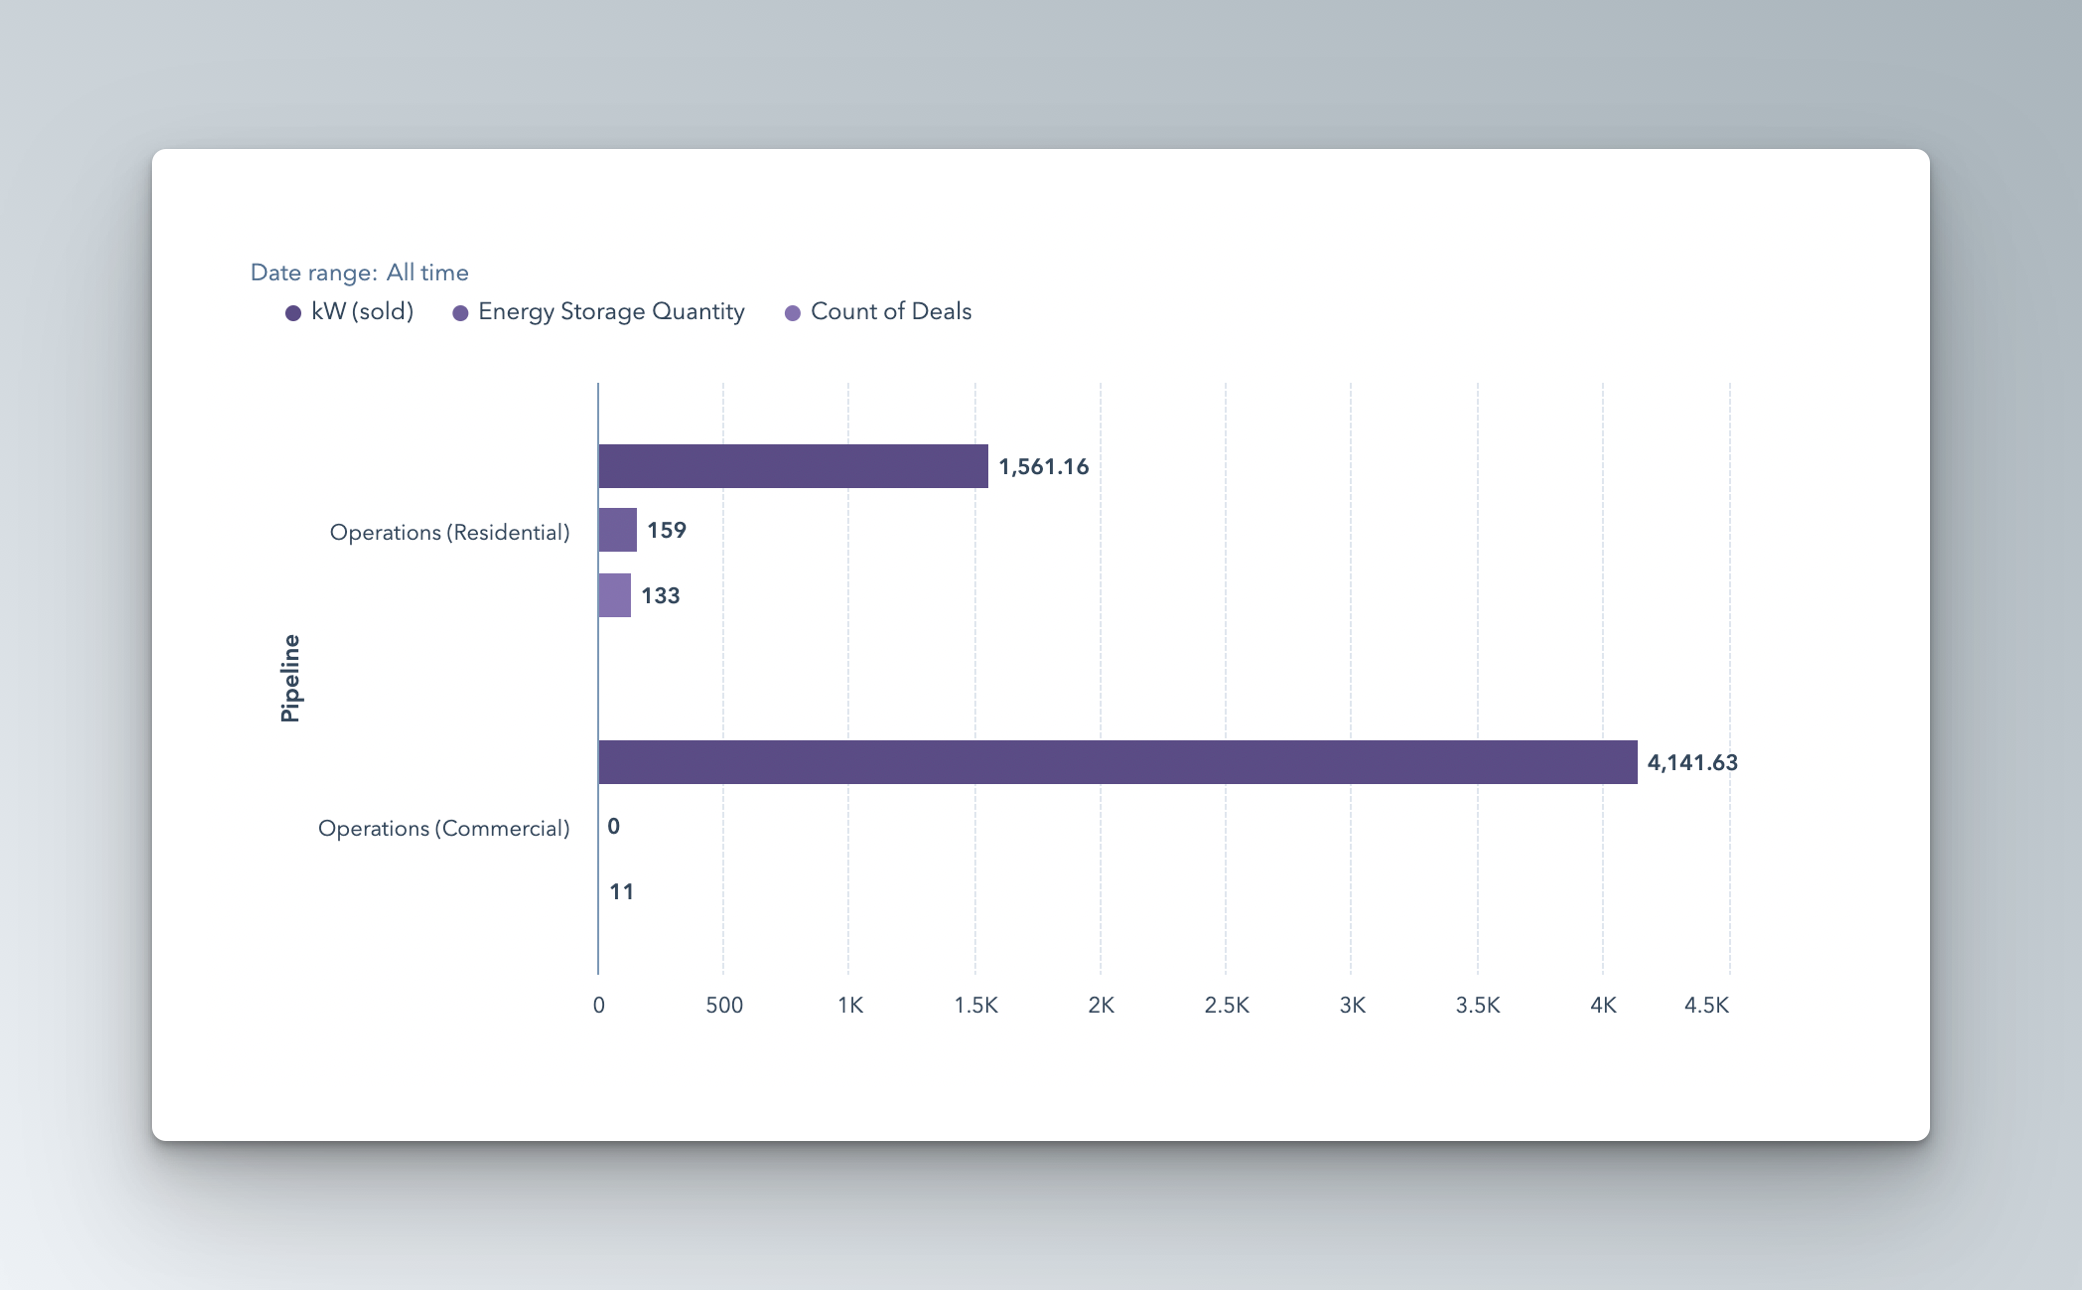
Most solar companies have a sense for their backlog, but using HubSpot you can make this report automatic and dynamic, so it changes as new sales come in and old projects move on.
If you’re like us, you’re trying to maintain a stable backlog (4 months in our case), and in combination with “Panels Installed by Month” - you can get a real sense for whether you are maintaining that when talking with customers and setting expectations.
Otherwise, you’re left with guesswork and probably making promises you can’t keep on the front end.
Did you know that Ipsun Solar has 500 reports in its library?
We offer to share them all with Sunvoy customers as a courtesy, because our mission is to strengthen local solar installers businesses.
We also have a solar version of HubSpot that we make available to Sunvoy installers, as we are a HubSpot Partner!
Reach out to learn more.
From "aha" to "oh crap", we're sharing everything on our journey to help install 100,000 residential solar systems per year.
We're learning a lot and so will you.
Residential solar systems installed through Sunvoy in the past year:
Real time metrics tracked bysunvoy
Before starting Sunvoy, Joe was the Co-Founder and COO of a top residential solar installer in Washington DC with 60+ employees and $12M+ in annual revenue. Now he helps solar companies scale far beyond through Sunvoy.